To match or mismatch? The Austrian VET system on struggle with diverse and changing demands

1. Background: A strong and complex VET system
1.1 Basic structures of the Austrian VET system
The Austrian VET system includes both a strong full-time school sector and a strong apprenticeship system, bringing about a very high share of VET qualifications at the upper secondary level. Figure 1 shows the proportion of the population which have completed at least upper secondary education. Austria ranks among the best three of EU 15 on this indicator.
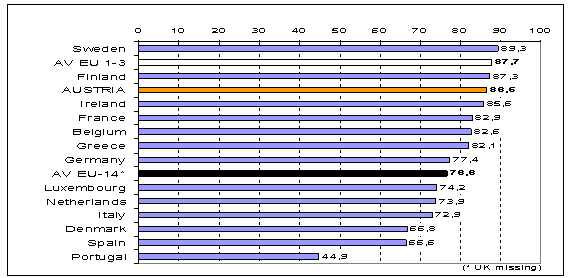
Figure 1: Percentage of those aged 22 who have successfully completed at least upper secondary education (ISCED 3), 2002 (Source: LFS)
The proportion of participants in VET or prevocational programmes is highest in Austria (Figure 2), and increased during the late 1990s as in France, Finland, less so in Denmark, whereas in most countries and also in the EU 15 this proportion decreased slightly. The rate of early school leaving, as measured by the structural indicator, is also low in Austria compared to the European level, and decreased in the late 1990s in line with the decrease at the European average (only two countries have shown an increase in that proportion: Portugal and Sweden). However, the contribution of a high proportion of VET participants at the upper secondary level to the completion rate and the proportion of early school leavers is not clear.
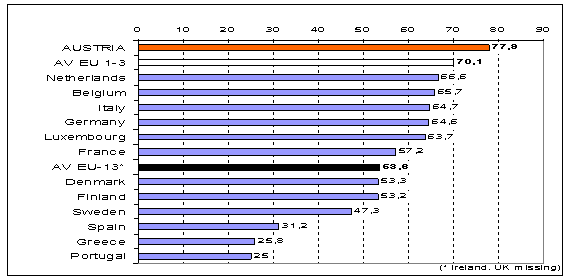
Figure 2: Per cent of enrolment of students in VET and pre-VET programmes at ISCED 3 level, 1999 (Source: Lisbon 2004, 321)
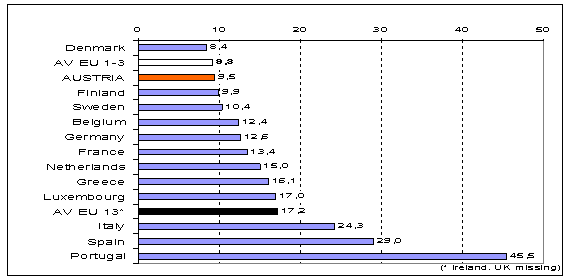
Figure 3: Early school leavers, share of population between 18-24 with only lower Secondary Education and not in Ed/Training, 2002 (Source: Lisbon 2004, 321)
The scatter plot of countries in Figure 4 shows an ambiguous picture. On the one hand there is a tendency for the completion rate to increase and the proportion of early school leavers to decrease with a rising enrolment in VET at the upper secondary level, however the correlation is weak, and there seem to be certain groups of countries amongst which this relationship is reversed. Thus, the three Mediterranean countries (Italy, Portugal and Spain) stand out with very low rates of VET enrolment and quite different completion and drop out indicators. Austria, with its outstanding proportion of VET enrolment, performs well on both output indicators. The remaining countries, however, with a medium level of VET enrolment between 50 per cent and 70 per cent show rather a reverse relationship: an increase of drop out and a decrease of completion with rising VET enrolment. Other factors than the mere size of VET seem to be important also, and the Austrian systems seems to be particularly able to capitalise on its VET system.
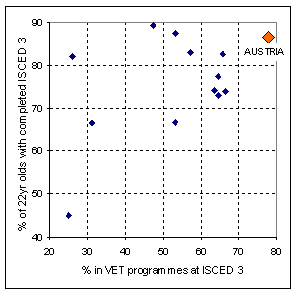
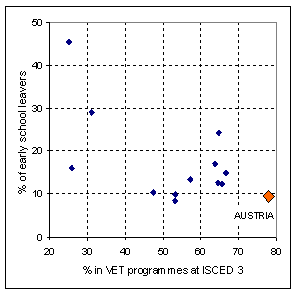
Figure 4: Per cent of enrolment of students in VET and pre-VET programmes (1999) compared to the upper secondary completion rate (1999) and to the proportion of early school leavers (2002)
The VET qualifications in Austria are rather specialised and are layered into three qualification levels: the 5-yrs Technical and Professional Colleges, the 1-to4-yrs Technical and Vocational Schools (both are full-time schools including certain amounts of workshop experience and enterprise practice), and apprenticeship training which is provided by enterprises with one to two days of part-time vocational school per week.
The Technical and Professional Colleges provide a double qualification, preparing graduates for access to professional areas and for access to higher education. The qualifications of the apprenticeship system are formally related to the structure of trades by providing qualifications required in the regulations for access to certain trades (additional qualifications are required for access to certain trades which are provided in the separate ÔÇ£MeisterÔÇØ education and training). Both types of full-time VET schools are also included in this comprehensive qualification framework in common with the apprenticeship system. Normally the full-time VET schools provide for a set of apprenticeship specialisations, that set being broader for Colleges than for Schools; thus the structure of these qualifications sets up a layered hierarchy between those tracks. This hierarchy is also reflected in the structure of the education of the VET teachers, as the higher the track of VET, the higher the qualification levels required from teachers (Higher education, VET qualification, practical training; some experience in working life is required for all VET teachers; see Lassnigg 2002a, Lassnigg, Stoeger 2000).
A study about the financial contributions of apprenticeship by the training enterprises has obtained a quite different profile compared to the German ÔÇ£dual systemÔÇØ (Lassnigg, Steiner 1997). The proportion of external teaching and learning in the part time VET school is about 20 per cent of the overall time of apprentices, the enterprise teaching time is between 20 per cent in the first year and 10 to 15 per cent in the third and fourth year, and the share of productive work increases from 40 per cent in the first year to 60 per cent in the fourth year, with a slight reduction of the proportion of simple tasks (from one third to one fourth) and an increase of more complex tasks (from 10 per cent to one third) during the training programme. As compared to Germany, the proportion of wage costs is substantially higher in Austria (70% of gross enterprise expenditure versus 50% in Germany), while the investment for training personnel and infrastructure is substantially higher in Germany (ibid. 16, 39). This profile corresponds to the estimate of the value of the productive work of apprentices, which lies markedly higher in Austria than in Germany (80 per cent of gross expenditure versus 64 per cent of gross expenditure), while the gross expenditure is at a similar level (ibid., 70). Overall, the intensity of explicit training inputs seems to be substantially higher in the German dual system than in Austria. The training is also very dispersed across small enterprises in Austria, with half of apprentices trained alone, and an additional third trained with only one or two colleagues in their training firm.
Figure 5 shows the changing proportion of young people in the four educational tracks at the upper secondary level since 1970. The academic track and the Technical and Vocational schools have remained rather stable (at below 20% respective around 15%), however, the Technical and Professional Colleges have won substantial enrolment (more than tripling its share from 8% to 26%) and apprenticeship has lost a substantial proportion of its students (one third from 60% to 40%). The estimate at the tenth grade represents the first year after the end of compulsory schooling, and subsequently some mobility from the Technical and Professional Colleges to apprenticeships occurs, thus reducing the big difference in participation rates between these two tracks a little.
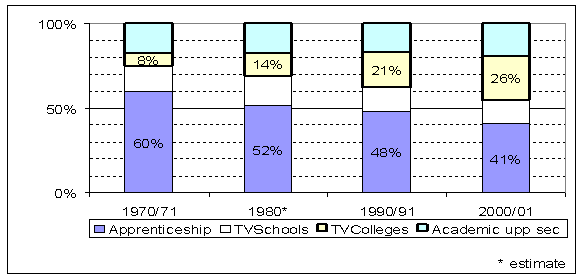
Figure 5: Proportion of learners in different educational tracks at upper secondary level (grade 10) 1970-1990 (Source: Schneeberger 2003, 15)
The evolution of the Technical and Professional Colleges was a policy priority in the 1970s, which aimed at the provision of professional qualifications. It also opened an additional pathway to higher education for students from lower social strata to overcome the early separation of secondary academic education from the mainstream at the lower secondary level. A result of this change of VET choices towards the Technical and Professional Colleges is that the upgrading of the supply of qualifications in the Austrian system is reached not within the different tracks but by the shift from the lower level tracks to the higher level tracks. Moreover, the choice of Technical and Professional Colleges by a substantial proportion of the age cohort reflects the aspiration to progress into higher education. That development is very much in line with the assessment given by the OECD about the broad trends in education and training demand.
Higher education is comparatively weak in Austria, and has been differentiated into two different layers ÔÇô universities and polytechnics ÔÇô during the last decade. The foundation of the VET oriented polytechnic sector (Fachhochschule) represents a turning point after the unifying process of higher education under the umbrella of the universities during the 1970s and 1980s. Some steps have also been made in the 1990s to strengthen the vocational and professional aspect of learning for university students (Mayer, Lassnigg, Unger 2000).
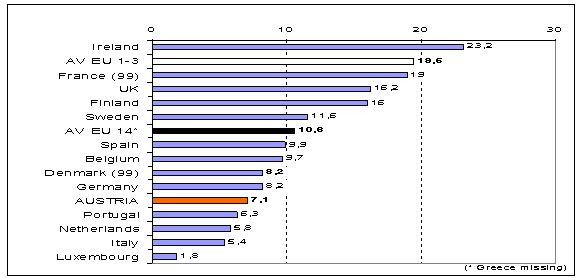
Figure 6: Science and technology graduates per 1.000 of 20-29yrs population, 2000 or 1999 (Source: EC 2002, 23)
The polytechnics have been established with a clear vocational and professional mission. An important element in the accreditation process for a study programme is a formal assessment of the demand for the qualifications of the planned studies (Lassnigg et al. 2003). Since the foundation year of 1993, the proportion of beginners at polytechnics has increased to about 15 to 20 per cent of beginners in higher education (depending on the figures taken), and this proportion is planned to increase further.
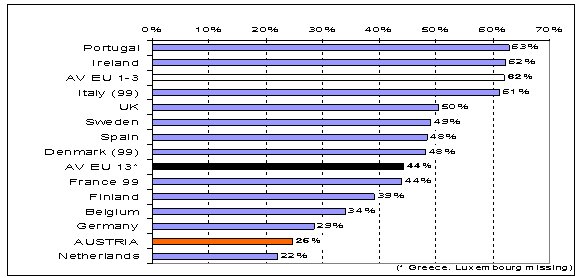
Figure 7: Proportion female to male science and technology graduates per 1.000 of 20-29yrs population, 2000 or 1999 (Source: EC 2002, 24-25)
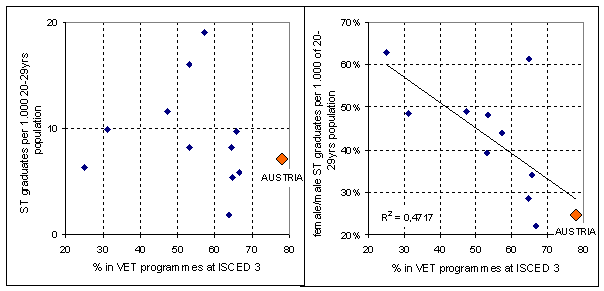
Figure8: Proportion of VET at upper secondary level to the supply and gender imbalance of science technology graduates
The gender imbalance in science and technology graduates is also much bigger in Austria than in Europe as a whole, which reflects indirectly the prevalence of a segmented structure of VET by gender (Bauer, Lassnigg 1997). The scatter plots in Figure 8 show some correlations between the proportion of VET at upper secondary level and the supply of science and technology graduates. The proportion of VET shows a curvilinear relationship to the supply of science and technology graduates in the population, with all countries with a proportion above 60% having a medium or low supply of ST graduates. The gender imbalance among ST graduates seems to be clearly related to the strength of the VET system at the upper secondary level.
In summary the basic pattern of the VET supply structure indicates that the Austrian VET system is very strongly developed at the upper secondary level and comparatively weak at the higher education level. At the upper secondary level both a strong apprenticeship system and a strong system of full-time VET schools is provided, which is layered by level and complexity of qualifications, with participation in the full-time schools gaining impetus within VET and providing the increased supply of VET qualifications.
1.2 Medium and long term changes by education and training choices
The educational choices of young people show a tendency towards upgrading, with the Technical and Professional Colleges that provide a double-qualification for professional work and access to higher education constituting the most rapidly expanding part of the system. The apprenticeship system seems to be left behind to some degree by these changes, with both sides of the apprenticeship market playing their role in that process. On the one hand young people try to access the upper level VET programmes, on the other hand the demand for apprentices from enterprises in certain sectors is also shrinking. An increasing proportion of the inflow into apprenticeship is built up by young people who started in full time VET schools. From the enterprise side, particularly big companies from the manufacturing sector have reduced their training capacity, with the tendency that apprenticeship training is increasingly concentrated in the more traditional sectors of the economy with a high proportion of very small companies. Political reform measures are tending towards a reduction in the formal requirements for training rather than to upgrading the system and increasing quality.
The increasing inflow to the Technical and Professional Colleges has provided a second pathway to higher education alongside the traditional first road via the academic secondary schools. This second road starts at the common track of lower secondary schools, is continued in the VET Colleges, and finished at university and, during the last decade, increasingly at the polytechnics. The prognosis of higher education (Dell'mour, Landler 2002) provides the basic information about the education and training pipeline in Austria. At the fifth grade at age 10 about 30 per cent of pupils change to the lower secondary academic track, and about 70 per cent continue in the common track. At grade nine ÔÇô that is the next point of choice ÔÇô a similar proportion of one third of either track (this means 10 per cent plus 23 per cent, thus totally about on third of an age cohort) change to the first year of a VET college (two thirds of the academic track or 20 per cent of a cohort continue in the academic track, and two thirds of the common track or about half of a cohort continue at lower levels or drop out as early school leavers). At grade ten apprenticeship starts, and about one fifth of first year students (about 7 per cent of a cohort) leave VET colleges, most of them changing to apprenticeship. Thus roughly one fourth of an age cohort continue at VET colleges, and as a result about one fifth of a cohort complete VET colleges, a similar proportion to the upper secondary academic track. In total, then, about two fifth of a cohort acquire the entitlement to enrol in higher education, and one fourth actually do (roughly 20 per cent to university, 5 per cent to polytechnics). The progression rate to higher education from those who are entitled to is about 60 per cent overall, and is greater from the academic track (80 per cent) than from VET colleges (40 percent). However, that rate signals that almost half of those young people who have acquired an upper level VET professional qualification continue their studies, and thus seem to feel that they need a further accumulation of qualifications. Looking at that process from the other side, half of the beginners of polytechnics have completed a VET college, more than half of them in a similar specialisation to that pursued in their polytechnic studies.
If we take into account demography we can foresee that in the longer term the interaction of the trends towards upgrading with the demographic decline of younger age cohorts might lead to a substantial change of the supply structure of VET towards upper level qualifications, particularly via the shift from apprenticeship to VET colleges. In combination with the high transition rate to higher education from VET colleges, a substantial shift in the structure of expenditure is implied in this development. First, the most expensive pathways are on the rise; second, the participation shifts from the mainly privately funded apprenticeship programmes to mainly publicly funded institutions. This development makes questions about the match of supply and demand increasingly important.
2. Basic patterns of match and mismatch
In this section some key aspects of measuring the relationship of VET supply and demands for qualification are discussed from different perspectives.
2.1 Supply and demand for VET in a cross-sectional perspective
As a first step, comparative and country specific evidence about the relationship between supply and demand is summarised in a cross-sectional perspective by education and training levels, and by broad occupational categories.
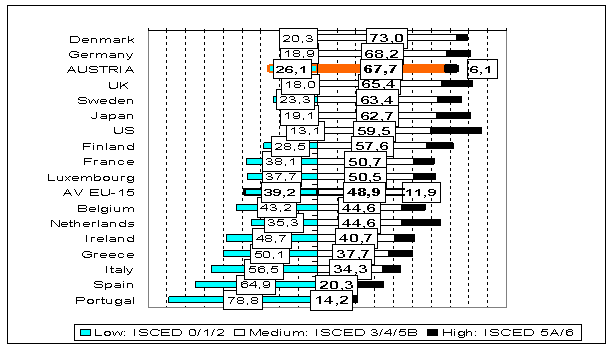
Figure 9: Educational attainment of the 25-64 yrs old population by levels, ordering by medium level, 1999 (Source: EC ÔÇô Enterprise 2002, 33)
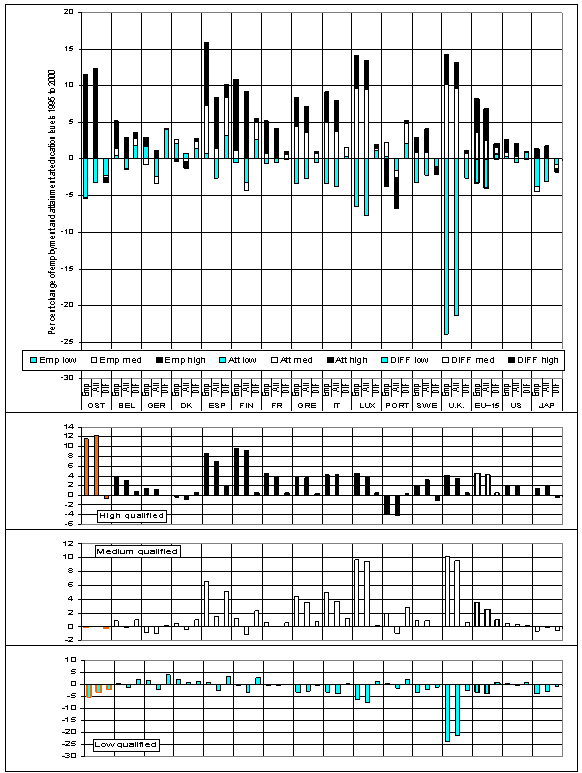
Figure 10: Growth rates of employment compared to growth rates of educational attainment by levels, 1995-2000 (Source: Source: EC ÔÇô Enterprise 2002, 29)
The European competitiveness report (EC-Enterprise 2002, Ch. 2) has applied a simple methodology for the measurement of the matching of supply and demand by broad education levels: employment growth at the three levels low, medium and high education and training is compared to the growth of attainment at those levels in the 15-64 years old population for the period 1995 to 2000. The comparison of the growth rates by calculating the difference gives a rough indication whether supply and demand are in line to each other. Figure 8 gives the basic distribution, and Figure 9 shows the comparison of the growth rates in employment and educational attainment in the late 1990s.
The high proportion of medium level education, as well as the low proportion of high level and of low level education can be easily seen. The overall dynamic shown in the upper part of Figure 10 is above average in Austria, as in Spain and Finland. A positive difference between demand growth (employment) and supply growth (attainment) signals that demand is more dynamic than supply and vice versa. Most European countries, as well as the EU 15 average, show a positive difference though Austria and Sweden are exceptions to that trend. In Austria the strongest dynamic is at the level of high qualifications with a small negative difference between demand and supply, however, in most countries demand for high qualifications has grown more strongly than supply. The medium level is more dynamic in EU 15 than in Austria where there has been almost no change. At this level the variation is biggest, and there seems to be an inverse relationship: the higher the stock of medium level qualifications, the smaller is the positive difference which indicates a supply gap. At the low level the Austrian pattern is similar to Sweden, Greece and Italy with an average decline of demand and supply. However, Austria is one of the countries (among U.K., Sweden, and Greece) with a negative difference at this level which signals oversupply of low qualifications. Contrary to the medium level, the difference of demand and supply growth is very loosely related to the magnitude of the stock of those qualifications, and the tendency is rather polarising than equilibrating. Overall, the Austrian structure is quite unique, lying rather at extreme points of the distribution of the stocks, and showing gaps which are at variance with the average development.
At the country specific level, the cross-sectional pattern of supply and demand of Austrian VET was analysed for a similar period in a national study by the main tracks of education and training and by broad occupational groups (Lassnigg 2002b, Lassnigg, Prenner, Steiner 1999). The results show a similar pattern to the comparative picture from above.
The development of the sectoral, occupational and qualification structure was projected on the basis of an economic forecasting model. Then the interaction patterns between those structural variables were decomposed by a shift-share analysis. The estimates for the formal qualification levels have brought about clear results indicating the upgrading of the work force. Higher education graduates and those from the VET colleges show high growth rates (+4.40 per cent and +3.25 per cent p.a.), medium-level qualifications are estimated to grow slowly (+0.01 per cent to +0.57 per cent p.a.), and the unskilled are in marked decline (-3.56 per cent p.a.). The composition effects that are due to the change of occupational vs. qualification structures contribute to a better understanding of this development. The high-level qualifications have strong positive effects on both sectoral and occupational variables (the employment field is expanding and the weight of these qualifications within the employment field is rising) while the unskilled category has strong negative effects on both variables. The medium-level qualifications show different patterns: in apprenticeship the employment field is shrinking, whereas this qualification level has a rising impact within that field ÔÇô in medium-level VET schooling the opposite pattern is estimated, meaning that the qualification level is losing weight in an expanding employment field. This pattern might indicate substitution or displacement effects at this level. However, some simple comparison have shown that occupational upgrading from given qualifications levels occurred much more frequently than occupational downgrading.
Another analysis tried to obtain the matching pattern between the supply of qualifications and the development of employment. That exercise projected the development of the future supply from the education and training system, and compared the results of that projection procedure to indicators from employment. The basic units for this comparison consisted of ten occupational categories (specialisations) for each of the four levels of specialised programmes at the upper secondary or higher education level. The results were based on a set of indicators, which have been calculated for the two periods 1991-1995 (past) and 1996-2000 (projection): (1) The proportion of the estimated yearly absolute supply (flow) from education and training to the stock of employment in each specialisation (ET-supply/EMPL-stock); (2) the proportion of (a) the growth/decline of the estimated yearly supply to the stock of employment in each specialisation as compared to the overall growth/decline of employment in this specialisation (b); (3) the cross-sectional distribution of qualification levels within occupational specialisations and vice versa.
The results have indicated some structural characteristics of the Austrian system. In terms of the overall structural homology of education and training as compared to employment, these indicators point to a low level of correspondence between the two systems, especially if the speed of change is the focus. In relation to the dynamics of shrinking employment in specialisations in the primary sector or in manufacturing, the decrease on the supply side was in most cases estimated at a considerably slower rate. The employment growth in service specialisations is not complemented by corresponding growth in education and training, but rather the supply is shrinking as well or remaining constant. Moreover, the indicator patterns point to a quite marked variability among the vocational specialisations, and also to quite marked discontinuities with respect to the comparison of the time periods. Thus the structure of the education and training system appears less stable than expected. However, the changes and discontinuities in both systems are diverging rather than corresponding.
Another structural phenomenon, which has been made visible by the results of the indicators, reflects the overall demographic development of an increasing relative scarcity of younger cohorts as compared to the medium-aged and higher-aged cohorts. Generally, positive signs of growth rates are markedly more frequent on the employment side, as compared to the education and training supply side. There are only two occupational categories which do not indicate at least small growth on the employment side in both time periods: occupations at all levels in the textile field in both periods, and the projected development of occupations in the education and science field in the second half of the 1990s. On the supply side only one occupational category (occupations in the field of social and health services) shows growth in both periods, and two additional ones (electricity/electronics/chemicals and the miscellaneous category) show growth in the second time period. The most common pattern on the supply side indicates a decline (agriculture/forestry, tourism, retailing and office work, textile) or stasis (construction, metals, education/science) during the second (projected) time period, following an actual decline during the first half of the 1990s.
A third structural result ÔÇô which, however, might be to some extent artificially reinforced by the classification procedure ÔÇô is pointing to markedly different relations in magnitudes between the supply from education and training on the one hand, and the employment figures on the other hand. As very crude orders of magnitude for a 'normal' replacement rate, based on the (of course more or less unrealistic) assumptions of stable employment and an even age distribution, we might refer to figures between 2.5 per cent (40 years life-time employment) and 2.8 per cent (35 years life-time employment). The first indicator (supply as compared to the stock) is rather high in the overall field of electricity-electronics-chemicals (8.1 per cent), and very high especially on the upper qualification levels (technical colleges: 40.4 per cent; university: 41.8 per cent). In some other partly shrinking vocational fields, or at least at certain qualification levels within those fields, this indicator has also shown high supply figures as compared to stocks of employment, ranging from 10 per cent to 35 per cent (agriculture/forestry, metals, education/science, textiles). In some other vocational fields, partly those which are estimated to grow (the miscellaneous category, tourism, retail and office work), the magnitude of supply is small as compared to employment (ranging from 1.5 per cent to about 4 per cent).
At the more specific level of vocational specialisations the pattern of estimated indicators points to rather distorted structural relationships between the supply side as compared to the demand side. The fields of metalworking and electricity-electronics-chemicals show corresponding developments on both the supply and the employment side, the supply showing in part greater growth compared to the employment figures. As these fields are critical in terms of economic innovation, those figures point to a favourable relationship of qualification and employment. In the service-oriented vocational fields (retailing and transport, office work and administration; tourism, social and health services) the indicators suggest that the supply side is lagging behind the development of employment by a considerable amount. In the vocational fields of agriculture/forestry and textiles the opposite seems to be the case, as the education and training system produces a high volume of qualifications relative to the shrinking employment in these fields.
Table 1: Indicators for the comparison of education/training supply and employment

2.1 Projections of supply in the medium and longer term
Projections about the development of the different parts of the VET system have been developed in the 1990s for different analytic and planning purposes. A key question for future development is, how the long term demographic downturn of the young population will be absorbed by the education and training system.
In the past, the educational infrastructure has been developed for age cohorts which are markedly bigger than those expected for the future. To obtain a basic mapping of the scope of possible development paths two extreme scenarios were calculated by simple and easily understandable procedures for the different parts of the education and training system: (1) a status quo scenario applied the transition rates of the last year before the projection (1983) to the demographic forecast; (2) a trend scenario applied the linear increase of the change of transition rates between 1983 and 1993 to the demographic forecast. Figure 11 compares the result of those scenarios to the actual development of student numbers. This exercise shows how the actual development fits into the scope between the extreme scenarios, and also how the actual decision making behaviour of young people might have changed in the 1990s as compared to the 1980s.

Figure 11: Long term projections of student numbers at upper secondary level, 1985-2030, relative, 1993 = 100 per cent (Source: equi-IHS)
The figure of the scenarios shows first that despite the demographic downturn the trend scenario gives quite a huge room for growth in the upper level schools; second that the continuation of the trend of the 1980s would lead to a very marked decline of apprenticeship training; and third that, from the point of view of planning, the beginning of the 1990s was a difficult period as the status quo scenario gives an increase at upper secondary level until 2005-10, followed by a long term decrease by 20 per cent.
The actual numbers signal a change in decision making behaviour very different from a continuation of the trend from the 1980s. Only the Technical and Professional Colleges follow almost the path of the trend scenario. The Technical and Vocational Schools decrease even more strongly than the trend scenario would have predicted. The two remaining tracks show marked breaks in the development. The upper secondary academic track has followed the trend scenario for some years and then turned down in the second half of the 1990s. Apprenticeship training has taken rather the path of the status quo scenario.
Thus the basic development of education and training choices is pretty much in line with the projection results about the demand from the employment system. The biggest challenge is the rising demand from young people for places in the VET colleges. The apprenticeship system needs more or less to hold the status quo.
2.2 Measures of mismatch
Another measure of mismatch between supply of and demand for qualifications is the dissimilarity of the educational structure by the three levels between different sectors of the population. Figure 12 shows the Austrian position as compared to the countries of the EU 15 and also the USA and Japan. First the change of the mismatch between the employed and the population is plotted for 1995 and 2000. The figure indicates an increasing mismatch for Austria between the employed and the 15 to 65 years old population. The people not in employment have a different educational structure than those in employment. The comparison of the matching situation in the overall population to the younger age groups of the 25 to 35 years old shows overall a better matching among the young, with five countries in the reverse situation. In Austria the relative position of the young population is better than the overall matching situation in 2000. The educational structure of the unemployed differs in most countries much more from that of the employed than that of the young population, and the same is true for the people out of the labour force as compared to the unemployed.
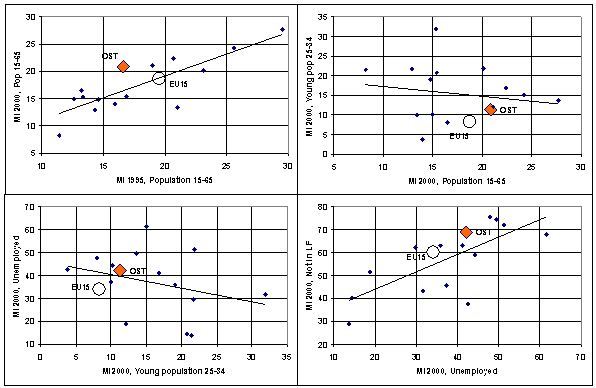
Figure 12: Mismatch indices: Dissimilarity of educational structure by levels of employed and different sectors of the population in the EU 15 countries and USA and Japan, 1995, 2000 (Source: EC ÔÇô Enterprise 2002, 36)
The overall relationships between these population groups differ: The mismatch in time, and between the unemployed and the people out of the labour force, seems to be rather positively related ÔÇô the more mismatch in a country on the one dimension, the more on the other. This indicates a difficulty to bring the matching in line at the overall level of the population, and a tendency of separation between the employed and the not employed parts of the population in terms of their educational structure. However, the relationship between the overall population and the younger population, and between the young population and the unemployed seems rather unrelated to each other, with a slight inverse tendency: the more mismatch on the first dimension, the less on the other. Thus the young population might improve the match in countries where the overall mismatch is big, but the incentives for improvement among the young might also be weak where the overall situation is relatively in line.
Layard, Nickell, and Jackman (1991, 310) have developed a mismatch indicator based on the variation of the unemployment rate due to the categories of structural variables on the labour market:
MM = 0.5 * var(u i / u) = log(u / u min )
They interpret the index as an increase of the unemployment rate because of structural rigidities, as compared to a theoretical minimal unemployment rate (umin) which should be the same for all categories of a variable. The value is zero, if the unemployment rate of all categories of selected variables is the same, a value of 0.3 means that the unemployment rate is 30% above the minimal possible value. If the structural distortions of the measured variables (e.g., education, gender, age, economic sector, occupation, region) are independent from each other, the indices might be summarised to an overall mismatch index. Because this is probably not the case, the summarised index indicates a maximum value of mismatch, with the real value somewhere below that.
Figure 13 shows the change and the average of the mismatch indices for six variables in the period 1994 to 2002. The variation of unemployment rates is biggest for occupational groups, medium for the educational tracks and economic sectors, and lowest for regions, age and gender. Mismatch has strongly increased for regions, increased for education, occupation and age, and slightly decreased for economic sectors.
The summarised index has increased from 0.3 to 0.4 during that period. For the same period the Beveridge curve, which is another more descriptive measure for mismatch based on the relationship between unemployment and vacancies did not indicate an increase of structural unemployment.
Overall, two observations stand out. First, that the methodology for the measurement of mismatch is in a rather rudimentary state of development to date. The measures give some indications about structural problems on the labour market, however, the contribution of the VET system is not sufficiently covered by those measures. Second, there is a large knowledge gap concerning the economic use of the specialised qualifications which are supplied by the Austrian VET system. There is no formal monitoring of match or mismatch, and the feasibility of the supply of qualifications is simply not known. The indicators presented here do not point to a very tight relationship between supply and demand in the Austrian VET system.
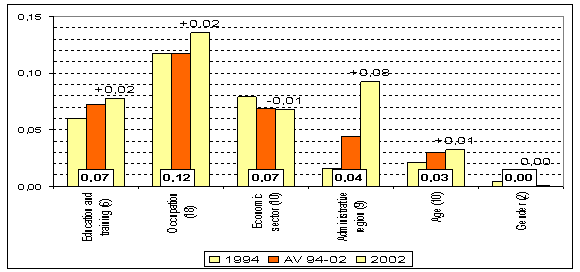
Figure 13: Mismatch indices for education, occupation, economic sectors, regions, age and gender, 1994, 2002, average 1994-2002 (Source: Lassnigg and Markowitsch 2004, 199-200)
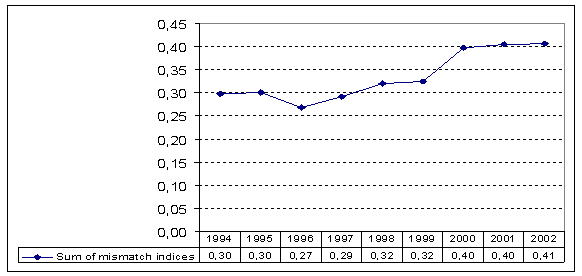
Figure 14: Summarised mismatch index in Austria, 1994 ÔÇô 2002
2.4 Mechanisms for definition, selection, and anticipation of competences
Concerning the process of definition, selection, and anticipation of the demand for competences the Austrian VET system carries a remarkable tension: on the one hand the teaching and learning process is strongly related to the provision of specialised qualifications, on the other hand there is an almost complete lack of formal mechanisms which would monitor the utilisation of those qualifications.
The adaptation of the programmes and curricula is based mainly on informal structures and performed in an incremental way, by adding new programmes and reforming curricula in medium term periods of five to ten years. Each of the different parts of the system ÔÇô apprenticeship, full time VET schools, polytechnics, and universities ÔÇô works very much on its own, unrelated and sometimes in a conflict driven and competitive relationship to the other parts of the system. This may be seen as a productive source of diversity, at least in some respects. As an example, it can be shown that in the periods of strong youth cohorts and slack economic demand, the different parts of the system did cope with the take up of young people in a distributed way, thus successfully preventing open unemployment of young people at the age of upper secondary education, and providing a medium level VET qualification for a high proportion of an age group.
However, the longer term sustainability of that system is not sufficiently known. There are periodical complaints about certain bottlenecks, and some endemic debates about the feasibility of the supply structure. A key question concerns whether the high weight of medium term qualifications in relation to the low proportion of higher education graduates, particularly in science and technology, does provide the right supply for the knowledge based economy. The advantage of a tight relationship to practice and of a focus on specialised VET competencies ( Fachkompetenz ) in this system, stands against a marked difference between practice and theory, and a difficulty to implement the new competences because of curricular overload and traditional work practices in training enterprises (Lassnigg and Mayer 2001). The programmes are geared to develop stable vocational or professional profiles and identities, where young people have to decide about their field rather early (at age fourteen), and the question how that structure might provide for a proper basis for flexibility is at stake.
At the upper secondary level, there is a quite marked difference in requirements and complexity between the different tracks (apprenticeship, VET schools, and VET colleges). Thus, the system does not include proper pathways, to build up future opportunities by a strong foundation function of earlier programmes. Rather the relative low academic requirements for access to wide areas of apprenticeship seem to provide a disincentive for compulsory school to bring a certain cohort of Austrian young people to a certain level of basic knowledge. These shortcomings are to some degree reflected in the failure of the polytechnic system to provide for new opportunities of non traditional access to higher education (Lassnigg and Markowitsch 2004). Graduates from polytechnics also have pointed to a lack of attention to the new key competencies during their studies. Those issues concern the supply side.
On the demand side, there is longstanding evidence that the Austrian economy is rather traditionally structured, with a weak and incremental innovation system. Despite political concerns over decades to strengthen R&D and innovation, the recent innovation scoreboard has classified Austria as one of the only four countries (with Estonia, Italy and the Czech Republic) which are declining on the innovation index (EC 2004). In fact, the structure of the VET system with its strong emphasis on medium level qualifications might reinforce that traditional structure, or at least hold back against a more dynamic push towards innovation. Thus the propositions brought forward by Krueger and Kumar (2004), arguing that more general than vocational education would promote the knowledge based economy might apply to the Austrian system.
3. Conclusions: Evidence based choices for future development?
The basic structure of the Austrian VET system was depicted as a strong and complex system with its main focus on different tracks at the upper secondary level on the one hand, and a rather weak sector at the tertiary level which has developed some dynamics with the establishment of the polytechnics in the early 1990s. At the upper secondary level the apprenticeship system and the VET colleges are the main tracks which differ in their aspirations and complexity. The development on the supply side points to a high and increasing preference of young people for the VET colleges, which however are used as a foundation for higher education to a very high degree rather than as an initial preparation for working life. The upgrading of the qualification structure thus develops mainly by a shift from the lower level apprenticeship system to the VET colleges, and further access to higher education. An upgrading within apprenticeship as, for example, by the German ÔÇ£ Modellversuche ÔÇØ is not being countenanced but rather quality requirements are being reduced in order to increase the incentives for enterprises to train apprentices. This shift also results in a shift of a substantial part of the investment in education from the private sector to the public sector, and partly to the most cost intensive institutions.
The review of how the supply of VET does match the demand from the economy shows first that rather weak and indirect evidence is available to answer that question. Looking at the development of employment compared to the qualification supply by broad levels of education and training, the upgrading of supply seems to proceed at a slower rate than the upgrading of the demand side. The matching of the VET supply structure to the development of employment by broad occupational groups is rather weak. The comparison of the educational structure of the different sectors of the population with the educational structure of the employed shows for Austria a rising divergence in the 1990s. However, within the younger population there are some signs of convergence. A more general mismatch index based on the variability of group specific unemployment rates signals rising mismatch between skill supply and demand.
However, those measures are far too loose and too indirect to derive conclusions about the direction in which the VET system should develop. Formal monitoring procedures about the match of supply and demand are so far lacking, so that the adaptation of VET programmes is based mainly on qualitative and informal procedures, and on the informal knowledge of actors from within the education and training system. Thus an evidence based way to take decisions about the future development of the VET system is not possible so far, and big uncertainties of how the VET system might contribute to innovation and the development of the knowledge based economy remain. The main question on the quantitative dimension is how far the expansion of the VET colleges and the polytechnics should be supported. On the qualitative dimension, there are three issues that need to be addressed: first whether the level of basic academic competences developed in the apprenticeship pathway are sufficient for the working life of the future; second whether the academic upper secondary institutions would be a better and more cost efficient preparation for higher education than VET colleges; and third whether the current shape and structure of the polytechnics are sufficient for the support of a more innovative economy.
References
Bauer, A., Lassnigg, L. (1997). Geschlechtsspezifische Unterschiede im ├Âsterreichischen Bildungswesen ÔÇô das quantitative Bild. In: Lassnigg, L., Paseka, A., (eds.). Schule weiblich ÔÇô Schule m├ñnnlich. Zum Geschlechterverh├ñltnis im Bildungswesen. Innsbruck, Vienna: StudienVerlag, pp.13-29.Dell'mour, R., Landler, F. (2002). Hochschulplanungsprognose 2002. Endbericht des Instituts f├╝r Demographie der ├ûsterreichischen Akademie der Wissenschaften, im Auftrag des BMBWK, Vienna. Online (short version):
http://www.bmbwk.gv.at/medienpoo l/8330/hb_2002_bd1.pdf (167-176; 7.12.2004).
EC (2002). Europäische Benchmarks für die allgemeine und berufliche Bildung: Follow-up der Tagung des Europäischen Rates von Lissabon. Communication from the Commission KOM(2002)629 final. Online:
http://europa.eu.int/eur-lex/de/com/cnc/2002/com2002_0629de01.pdf (rev. 7.12.04).
EC (2004). European innovation scoreboard 2004. Comparative analysis of innovation performance. Commission staff working paper. SEC(2004)1475. Brussels.
ECÔÇôEnterprise (2002). European Competitiveness Report 2002. Commission Staff Working Document SEC(2002)528. Luxembourg: OOP-EC. Online:
http://europa.eu.int/comm/enterprise/enterprise_policy/competitiveness/doc/competitiveness_report_2002/cr_2002.pdf (rev. 7.12.2002).
Krueger, D., Kumar, K.B. (2004). USÔÇôEurope differences in technology-driven growth: quantifying the role of education. Journal of Monetary Economics 51, pp. 161-190.
Lassnigg, L. (2002a). Professionalism as a path for the reform of VET systems. In Nijhof, W.J., Heikkinen, A., and Nieuwenhuis, L.F.M. (eds.): Shaping flexibility in vocational education and training. Dordrecht: Kluwer , pp. 183-205.
Lassnigg, L. (2002b). Projections of qualifications and occupations in Austria: Short-term approaches, macro perspective and emphasis on the supply side. In: Neugart, M., Sch├Âmann, K., (eds.). Forecasting Labour Markets in OECD Countries. Measuring and Tackling Mismatches. Cheltenham: Edward Elgar Publishing .
Lassnigg, L. (2004). The Austrian ÔÇ£FachhochschuleÔÇØ reform: what can we learn from the implementation of new funding and governance mechanisms? Paper submitted to the 2004 General Conference of the Programme on Institutional Management in Higher Education (IMHE): CHOICES AND RESPONSIBILITIES: Higher Education in the Knowledge Society, 13-15 September 2004.
Lassnigg, L., Markowitsch, J. (2004). Qualit├ñt durch Vorausschau Antizipationsmechanismen und Qualit├ñtssicherung in der ├Âsterreichischen Berufsbildung. IHS-3s research report. Vienna: IHS (forthcoming Innsbruck: Studienverlag).
Lassnigg, L. et al. (2003). Evaluierung des Auf- und Ausbaus des Fachhochschulsektors. IHS research report. Vienna: IHS. Online:
http://www.bmbwk.gv.at/universitaeten/pm/publ/Review_des_Auf-_und_Ausb9814.xml (rev. 7.12.2004).
Lassnigg, L., Mayer, K., (2001). Definition and Selection of Key Competencies in Austria. Country Report on the BFS-OECD Project DeSeCo. IHS, Sociological series No. 53 (extended German version IHS, Sociological series No. 52 ). Vienna: IHS. Online:
http://www.ihs.ac.at/publications/soc/rs53.pdf (rev. 7.12.2004).
Lassnigg, L., Prenner, P., Steiner, P. (1999). Die Zukunft der ├Âsterreichischen Qualifikations- und Berufslandschaft. AMS report 9. Vienna: Wissenschaftsverlag. Lassnigg, L., Steiner, P. (1997). Die betrieblichen Kosten der Lehrlingsausbildung . Materialien zu Wirtschaft und Gesellschaft Nr. 67. Kammer f├╝r Arbeiter und Angestellte f├╝r Wien. Vienna: AK.
Lassnigg, L., Stoeger, E (2000). Professionals for Vocational Education and Training in Austria - Report for the EUROPROF-Project. IHS research report. Vienna: IHS.
Layard, R., Nickell, S., Jackman, R. (1991). Unemployment. Macreconomic performance and the labour market. Oxford: OUP.
Lisbon-to-Copenhagen-to-Maastricht Consortium (2004). Achieving the Lisbon goal: The contribution of VET. Draft final report to the European Commission 09-09-04. London: QCA.
Mayer, K., Lassnigg, L., Unger, M. (2000). Social Dialog on Training, Case Study Austria . IHS research report commissioned by CEDEFOP. Vienna: IHS. Online:
http://www.equi.at/pdf/socialdialog.pdf (rev. 7.12.2004).
Schneeberger, A. (2003). Trends und Perspektiven der Berufsbildung in Österreich. Ibw-Mitteilungen, September 2003, 1-29. Online:
http://www.ibw.at/ibw_mitteilungen/art/schn_098_03_wp.pdf (rev. 7.12.2004).

